|
Base module enables to: |
|
 |
Create a project database: |
|
|
 |
Input and edit maps, core and well logs
interpretation data; |
|
|
|
Export & import from external databases; |
|
|
|
Translate irregular data to regular grid
(including unparalleled algorithms of interpolation, taking into
account disturbances); |
|
|
|
Change scale of the matrix data (to translate
maps from a scale to scale); |
|
|
Visualize data sets, |
|
|
Print and plot maps by various devices
including the following functions: |
|
|
|
Rescale, |
|
|
|
Image type modification (colors, contours,
hatching); |
|
|
|
Plot composition from several different parts; |
|
|
|
Layout output to printers/plotters in various
formats; |
|
|
Interchange data between modules and packages
of Multi-D Interpretation software system: |
|
|
|
Produce maps of sections from interpretation
results and initial data; |
|
|
|
Export data from ADI to
PMDI
for visualization and comparison with PMDI results. |
|
 |
|
The tool allows to increase the number of the
attributes related to reservoir characteristics and to discover
the Multi-D attributes that best reflect each one of the reservoir
properties.
The programs of ADI Information Advancement Tool enable to:
|
|
|
Transform maps in order
to extract the most meaningful information from the initial data,
by computing: |
|
|
|
Derivatives on different directions and mixed
derivatives; |
|
|
|
Statistical transforms (variances of surfaces,
deviations and medians); |
|
|
|
Invariants (gradients, curvatures, differential
invariants, Euler delta); |
|
|
|
Local and regional components (space filtering
results); |
|
|
|
Specialized transforms for potential and
quasipotential fields (integration and differentiation); |
|
|
|
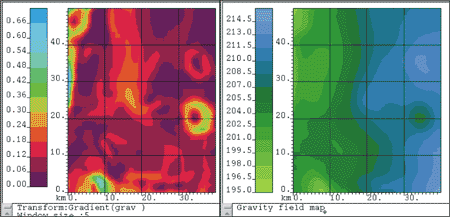
Gravity field to pseudo-magnetic and magnetic
to pseudo-gravity fields converting; |
|
|
|
Continuation into upper and lower half-space, |
|
|
|
Calculation of 1-st, 2-nd and 3-d derivatives
in gradient direction, probable faults mapping. |
|
|
Determine correlation between attributes,
and attributes and reservoir parameters defined in well data, including
the algorithms of: |
|
|
|
Kendall correlation; |
|
|
|
Spearman correlation; |
|
|
|
Pearson correlation. |
|
|
Analyze relationships between
Multi-D attributes
themselves and between Multi-D attributes and
parameters using: |
|
|
|
Hierarchical classification; |
|
|
|
Singular numbers analysis; |
|
|
|
Regressor’s selection. |
|
Classification Tool allows to obtain
qualitative view of prospective oil and gas zones even when well
data are insufficient for parameters mapping or without well
control at all. The user can |
|
|
Divide the area into parts with different
geological and lithological properties, and |
|
|
Estimate prospectivity of different zones and
points. |
|
The tool consists of: |
|
|
Taxonomy
- Program for classification without reference points |
|
|
Anomaly
- Program of multicomponent analysis (identification of anomalous
zones using a set of geophysical parameters without reference
points) |
|
|
Clustering
- Program for dividing an area into zones by the similarity to
reference points (membership function) |
|
|
Topology Quality
- Three programs for dividing an area into classes, with and
without using the multiple qualitative reference data (based on
algorithms of a self-coordinated choice and ergodic theory of
Markov chains) |
|
The Quantitative Prognosis Tool is designed to: |
|
|
Extrapolate variety of reservoir parameters
from well logs into inter well and surrounding areas; |
|
|
Locate the most prospective and optimal
drilling points for exploration and development. |
|
The tool consists of: |
|
|
Three modifications of Contouring
program based on regression analysis allowing to compute
parameters, with and without superimposed restrictions, |
|
|
Robust Contouring
program allowing to automatically exclude the wells with
contrasted parameters from the computation using the established
relationships; |
|
|
Multiregression
program allowing to obtain the forecast in different blocks of the
area and then automatically unify and extrapolate them into the entire area; |
|
|
Topology Quantity
program for computing a value of a parameter in any point of the area
as a function of the distance between the point and each
reference well in the
Multi-D attributes
space. |
|
Contouring
algorithms enable to discover the relationships between Multi-D
attributes and well data. Once the relationship being established
is applied to the whole area, it is produced a map of the
parameter. Also the tool allows choosing the combination of data
sets, which possesses the most quantity of information, to discover
and delineate prospective objectives and to evaluate reservoir
parameters. The program represents an extremely powerful and
necessary tool for making the final prognosis. An informative
combination of the data can be stored and used for parameter
monitoring during subsequent drillings.
Topology Quantity
program calculates the parameters defined in wells for each
particular point.
The weight of each reference well, nonlinearly depends on a
difference between
Multi-D attributes at the well
site and at the point of interest.
All the quantitative results are computed together with
uncertainty and reliability of the estimates (multiple correlation
coefficient, standard deviation, regression rank, etc.) and errors
maps (uncertainties) . |